The Inclusion Impact Index
Steve built your phone. Mark connects your friends. Larry runs your searches. Reed streams your shows. Jeff sells you everything. Jack lets you complain about it (and pay for coffee). Elon built your car and spaceship...or at least Wall St. seems to think he did. And Bill got the whole things rolling1. It’s clear that America has a bit of a type when it comes to successful entrepreneurs. They are supposed to “think different” but not be different—at least, not different from central casting’s vision of a “nerd tycoon”.
And yet, female entrepreneurs in New York City have fought to overcome sexism and underfunding to create millions of jobs. In San Francisco alone, despite all of the headwinds, Queer entrepreneurs have brought in billions in startup funding. In fact, entrepreneurs across the United States–LGBTQ+, women, Black, Latine, Refugees, and more–have contributed enormous numbers of jobs, patents, and dollars to their cities.
These discoveries are revealed by the new Inclusion Impact Index. And yet, the Index also reveals the 17 million jobs and $400 billion in funding could have added to a more inclusive US economy but was ultimately lost.
We created the Index to help innovative minds create jobs and transform their cities. It is a tool to illuminate the drivers success for all entrepreneurs in your community–your own sons, daughters, and neighbors.
The Inclusion Impact Index is simultaneously a dataset, an algorithm, an economic model, and a website. It focuses on the impact of high-growth entrepreneurs from historically marginalized populations. Research has shown that female, Black, and Queer founders, among many others, experience systematic barriers to founding new companies. The Index measures both the existing contributions of these entrepreneurs to their home cities and the achievement gaps caused by those systemic barriers.
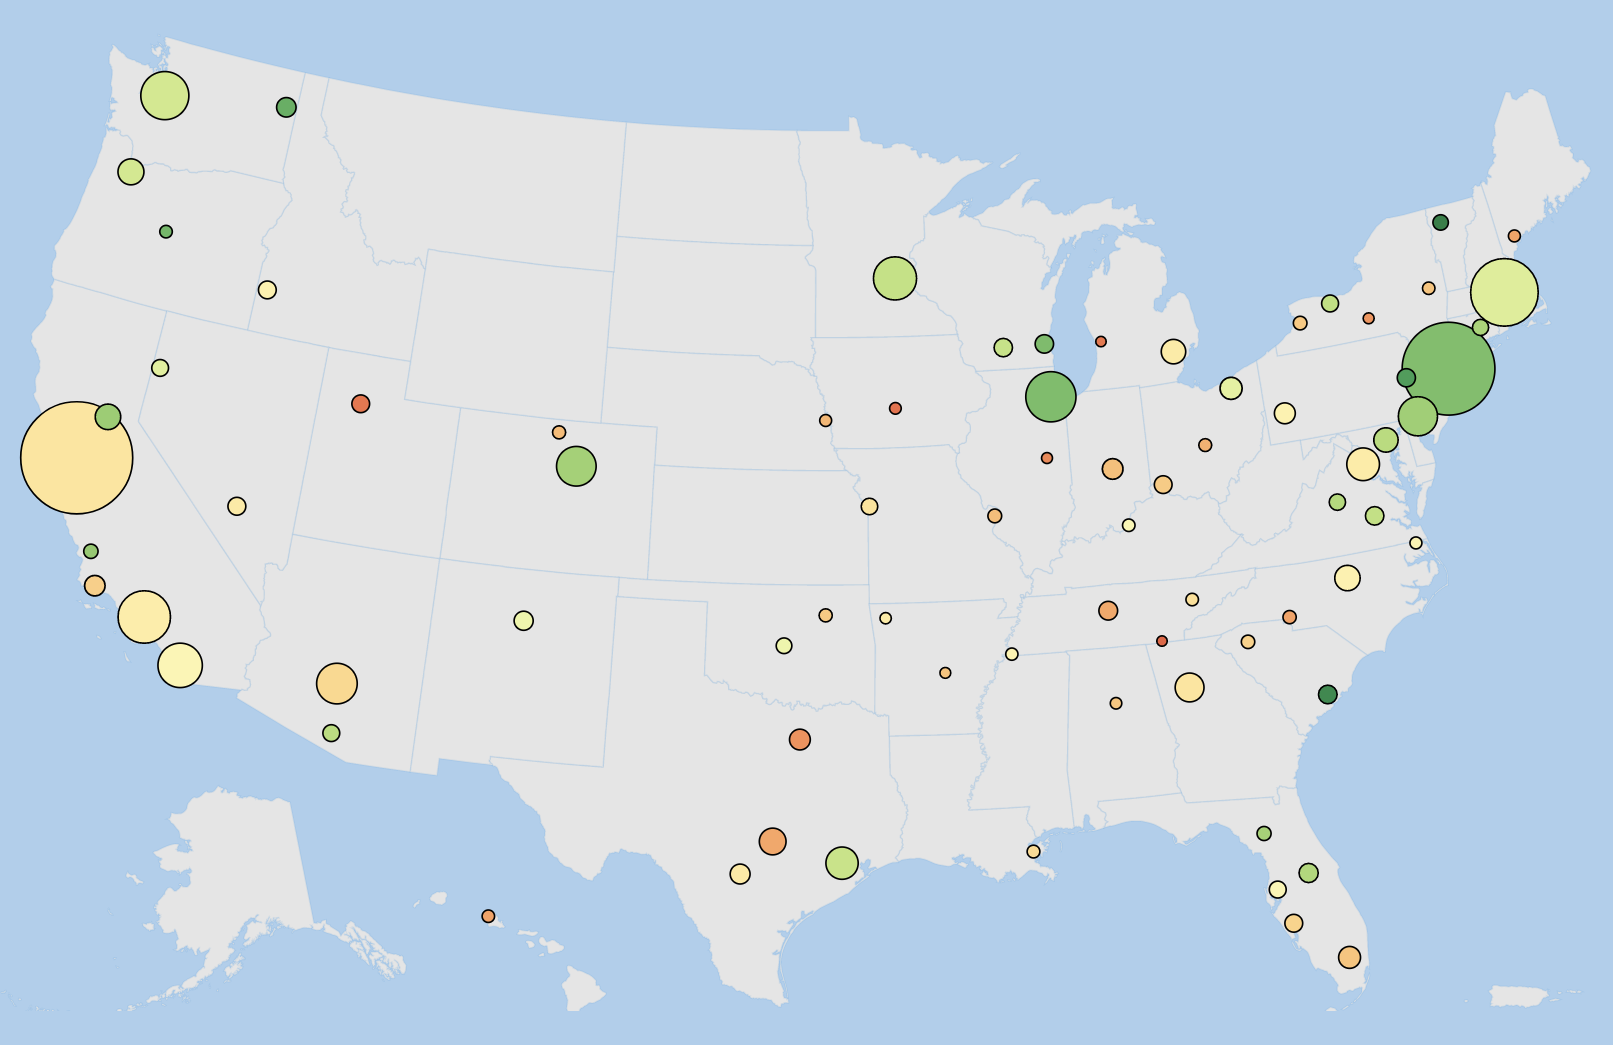
Open the Index and you see a map. The map is covered in bubbles of varying sizes and colors. Each bubble represents a Metro: more than just cities, these are entire metropolitan regions as defined by the US Census2. The size and color of each bubble represents the economic impact of high-growth entrepreneurs on each Metro.
“Entrepreneur”, much less “high-growth entrepreneur”, can be a challenging thing to define. We are not talking about anyone who starts a local business or executives at large companies, but rather, in the abstract, anyone who starts a business with an addressable market of a billion dollars or more with the explicit intention of capturing a significant portion of that market. The biggest impact on the economy–new jobs, IPOs, and economic growth–comes from high-growth, disruptive companies, and startup founders have a unique connection to those measurable outcomes. Recognizing that companies are started by founding teams and rarely by a single person, all individuals present at a company before first funding are included in our dataset of entrepreneurs3.
The Index is solely interested in the founders of these high-growth companies. It uses two company-level data sources, Crunchbase and Pitchbook, which contain information about companies’ founders, industry, location, funding history, employment and job creation, and exits (e.g. IPO and acquisitions) and are updated on a regular basis. The Index further augments its dataset with additional information from Wikipedia, the US Patent and Trademark Office, and the US Census Bureau.From these data sources, the Index constructs a set of approximately 57,000 companies and then filters out all companies that don’t meet at least one of the following criteria:
- it has received any amount of Venture Capital funding, or
- it has received at least $1 million in Angel funding, or
- it has generated at least one patent and has created jobs beyond the founding team.
These criteria allow us to be flexible in our definition of a high-growth company, allowing for organizations that have had an impact even in the absence of institutional funding. This leaves the Index with 57,000 companies and 85,000 founders.
So, when you look at the map, you see the impact of each Metro’s founders on the economic life of their neighbors. Although these founders may be women or Queer, the jobs they create, the treatments they discover, the technologies they build, are for everyone.
When I founded my first tech company, Augniscient, we were using machine learning to try and transform education. I had a lot of fancy degrees and we had a very sexy demo. The venture capitalists (VCs) loved our technology. As one of them put it, “You can read students’ minds4?!” But as much as he loved the technology, he had zero interest in funding me as a founder, “There’s $2 million if you do financial fraud detection...and I have the perfect CEO for you.”
I’ve raised venture capital for half a dozen companies, and there has never been a female VC to hear a single one of those pitches.
Even though I had built all of the technology and the startup was just on the cusp of a major EdTech revolution, I was already being fired from my own company without a single contract being signed. He simply couldn’t imagine giving money to a woman.
I’ve raised venture capital for half a dozen companies, and there has never been a female VC to hear a single one of those pitches. Whether they voted yes or voted no, no one casting a vote was female or Black, none were to the best of my knowledge openly Queer. They networked at baseball games with my co-founder. They told incredibly uncomfortable jokes, and yes, once one even patted me on the head.
With some dumb luck and a few successes, I now get cold calls from VCs wondering if I have anything for them to invest in. What it took to get there is a Tax5 that stole from the impact of my earlier work and kills the careers of so many other entrepreneurs from marginalized groups. None of those VCs were intending to be the villains of my story, but bias is corrosive. It harms them, and me, and everyone else. We fail most when we refuse to acknowledge and change it.
Each of these gaps–wage, hiring, education, promotion, funding–comes with compounding interest that none of us can afford to pay.
Research has shown that male vs. female names, “Black” vs. “white” names, and a variety of demographic indicators will completely change an employer’s perception of a candidate. Even subtle cues about social status will change perception of seemingly equally qualified candidates (and sometimes in unexpected ways). And so long before the wage gap comes into play, the hiring gap robs our nation’s potential. Each of these gaps–wage, hiring, education, promotion, funding–comes with compounding interest that none of us can afford to pay.
For my own part, I used Gild’s data to actually measure the dollar value cost of being different in the workplace–the cost of being Joe vs. José, the cost of being a woman in the tech industry, the cost of being gay in the UK. When I added up these numbers they were enormous and I saw an easy interpretation. It was The Tax on Being Different. Just like any other Tax, it slows growth and undermines productivity. Unlike a formal Tax, it’s just heat loss on our economy. No bridge has been built from the wage gap. No teacher has been paid from the hiring gap. The Tax on Being Different may harm marginalized groups the most but it affects and robs all of us.
The Tax also changes the way people make decisions about the future. If you know that your hard work will pay off less than a similarly qualified person, you’ll put that hard work somewhere else. My research has found how this choice affects education gaps. It has provided a novel understanding of gender pay disparities. Given that founding a company can be brutally hard in the best of circumstances, why would you even bother if you had to pay the Tax while others didn’t?

You can see from the fingerprint that no individual industry dominates entrepreneurship in the US. The largest industry by count is Biotech. Roll over it and you can see a hover box with detailed information. For example, Biotech is made up of over 4,500 companies and is part of the broader Health Care sector. You can also see its ecru coloring puts its Industry Index at 42, just below the national average. There are other prevalent industries in the Health Care sector, including Health Tech, Health Services, and Pharma. Well over 10,000 companies in the Index are part of the Health Care sector and all have a similarly mediocre Industry Index. The second largest industry is the grassy green of Software. Rolling over that region you can see that it has 2,800 companies and is part of the Information Technology sector. Other industries in IT include SaaS, Enterprise Software, AI, and others, adding up to over 13,000 companies. Unlike Health Care, you can see that the industries in IT are quite variable in their Index Score. For example, female entrepreneurs in Software experience a dramatically smaller achievement gap than in SaaS. It is well known that the vast majority of venture funding goes to software-based startups with relatively little for biotech or manufacturing; however, using the Index’s fine-grained analysis by industry, you can see pronounced differences in inclusivity within specific IT industries. You can also see the relatively large number of female entrepreneurs working inside the broader health technology and manufacturing sectors. These differences in industries offer insight into why some Metros are particularly challenging or successful for female entrepreneurs.
Every day exploring Gild’s dataset of 122 million working professionals led to new discoveries and insights about the very nature of work and how well society keeps its promises. Having started many companies, I became curious with what our data had to say about both entrepreneurs and the VCs who fund them. As I’ve said, across the dozens of times I’ve pitched my companies, there was never a female senior partner in the room. Given my experiences as an entrepreneur, could Gild’s data reveal evidence of similar bias for the VCs themselves?
Let’s start with three states: Texas, Florida, and California. All three have large economies, large diverse populations, and substantial rates of high-growth entrepreneurship, and yet I found one inexplicable difference. I released my algorithms through Gild’s data and found that Florida had the highest percentage of female VCs, just over 11%. That is hardly anything to brag about, and yet it’s still best-in-class. California, for all its progressive entrepreneurial zeal, came in at just under 10%. An even lower number comes from a report by Crunchbase, which found, “7 percent of investing partners at the top 100 venture and micro-venture firms are women.” Apparently misunderstanding the rules of the game, Texas beat them all to the bottom at 2.3%.
Surely women in Texas aren’t one fifth as qualified as women in Florida and California. Even those CTOs and money men who have secretly confided their belief that female VCs just don’t perform as well as men18 would have a hard time justifying this gap. It might hearten them to know that female VCs are just like men. They have a strong preference for pitches from male entrepreneurs, even just a male voice for an identical pitch. They also have a similar preference for “attractive” male entrepreneurs and are just as likely to undermine female founders with questions about losses while supporting male founders with questions about gains. All of which is insane given that we know from research done by BCG that female-founded startups receive less than half the funding given to men and yet turned each of those dollars into twice as much revenue as their male counterparts.
My research into The Tax on Being Different and the experiences of female VCs led me to wonder about the impact of historically marginalized entrepreneurs. Whatever the barriers, people from many backgrounds have founded companies that have transformed our society. I wanted to measure the barriers they experienced and the contributions they made. Unsurprisingly, there is a fair amount of research on the challenges of non-traditional entrepreneurs, particularly women. For example, VCs of all genders adopt similar gender-stereotyped language to negatively describe identical qualities in female founders (“young and inexperienced”) that are favored in their male peers (“young and promising”).
Other research has found that male and female entrepreneurs are punished for exhibiting stereotypically feminine behaviors during their pitches, or that female founders express their social mission because those that do are more likely to get funded. Unfortunately the researchers themselves use their findings to argue that non-straight-white-male entrepreneurs shouldn’t be themselves, that they should conform to the biases of the VCs19.
From all this research and the work of so many others, we see these gaps persist for founders who violate VCs' self-claimed Jedi-esque pattern matching abilities. I wanted to build a tool to explore the experiences and impact of all entrepreneurs. Motivated by analyses at the Brookings Institute and elsewhere, I wanted that tool to measure how these entrepreneurs impact their cities in particular, driving growth for their neighbors.

The Index allows you to choose the axes for your plots so you can test hypotheses about your Metro. For example, what is the relationship between Index Score and GDP? Click on “Metro Population” and you’ll open a drop menu of other variables. Select “Index Score” to test your hypothesis. Again, watch the pretty bubbles drift across the screen, now running red to green across the horizontal axis. As you look from left (red) to right (green) there does not appear to be a dramatic relationship between “GDP” and “Index Score”. Albuquerque has a worse GDP than all of the deep red Metros on the left, and yet it has one of the highest mean Index Scores. In fact, the Index suggests that the worst performers are neither especially wealthy nor desperately poor.
You will return to the “Plot” tool soon to answer some of the questions posed above. But first, as we are looking at the mean performance of female entrepreneurs, click on the “Chart” button. You see the mean funding rate of female entrepreneurs cleanly ordered by Metro. Albuquerque has the highest average funding rate at nearly $20 million generated per female founder, with Houston, Sacramento, and Atlanta close behind. These aren’t exactly the prototypical Metros for entrepreneurship. Shed one small tear for the women of Honolulu (on the far right), bringing in a meager $360 thousand in mean funding (and then remember that they are living in Honolulu). The “Chart” view affords a clean look at a single variable to easily compare every Metro.
Wanna see something wild? Keep your eye on the top performing Metros for “Mean” funding and then click “Totals” and watch everything change.
In addition to “Funding”, the chart allows you to explore a variety of different variables, including “Jobs”, “Patents”, and entrepreneurship rate. In the next section, you will use “Plots”, “Charts”, and other Index tools to begin to understand how to reinvent your city.
In 2014 I joined the board of StartOut, a nonprofit supporting the impact and diversity of Queer entrepreneurs. My secret mission was to run a research program into the “state of LGBT entrepreneurship in the U.S.” and by 2016 we produced our report. It was unique because while there has been significant research on female entrepreneurs, there has been comparatively little on the contributions of Queer individuals to the economy. I had already found that there was a “cost” to being Queer, but what was the gain to communities when founders could be themselves?
Our final report, co-authored with fellow board members Chris Sinton, Waverly Deutsch, and Mary Shea, sought to understand what drove Queer entrepreneurs to start businesses, where they grew up, launched, and migrated, what their experiences were in securing funding, and more. We combined a large-scale survey with a big data analysis in which I again leveraged my access to Gild’s unique dataset but also combined it with other public data on entrepreneurs.
It is often said that talent is more valuable around other talent; so many states were robbing themselves of this potential talent by exporting their own highly creative sons and daughters.
Our analysis showed that states lacking in inclusive policies lost many, if not all, of their high-growth Queer entrepreneurs before they even founded their companies. Also, when established Queer founders moved the headquarters of their companies to a new state, 78% moved to California, New York and Illinois. This translates to over 1 million jobs lost for regions unfriendly to the Queer community. It is often said that talent is more valuable around other talent; so many states were robbing themselves of this potential talent by exporting their own highly creative sons and daughters.
Even in inclusive states, our survey found that 37% of Queer founders chose to remain closeted during the funding process. Some cited concerns that their sexual orientation might hurt their chances of success in the funding process, while others simply claimed that “being out” wasn’t relevant to raising capital. That latter perspective forced an almost paradoxical relationship with investors. For example, one VC swore that “being Queer didn’t matter” and that he had no right to know about his founders’ personal lives; yet he later expressed that he’d be offended if one of his straight founders didn’t invite him to their wedding.
In retrospect, I admit that I never shared my background with the venture firms I pitched (though of course, it was always easily Googleable). It seemed to me rough enough just being a woman, and sure enough, our survey showed that some things held true even for Queer entrepreneurs: while 70% of funded female Queer entrepreneurs raised less than $750 thousand, 47% of male Queer entrepreneurs raised more than $2 million, mirroring the funding gap in general.
It was incredibly exciting to have contributed something so new to the world. Questions I’d wondered about for years had answers–or at least the start of answers. All those jobs migrating out of non-inclusive cities inside the heads of fleeing entrepreneurs seemed like a mad, self-inflicted wound, but who needs a finger-wagging lecture, another shaming exercise across cultural borders. For insights like these to be truly useful, I felt that they needed to be local; they needed to answer the very honest question, “What should my city do?”

What the hell is going on in California? It’s supposed to be a global center for entrepreneurship, but looking at the “Totals” view on the “Map” reveals that the big three cities all have big achievement gaps. Instead, it is state-capitals-bar-bet-answer, Sacramento, and “I’ve never heard of it before” San Luis Obispo, that look most hospitable for women. If you’re the mayor of any of these cities, what do you do?
You can use the Index to answer this question. Click on the bubble for LA. You immediately see the “Metro Data” breakdown for Los Angeles. The Index estimates that LA could have had more than half a million additional jobs if it closed its achievement gap. In fact, across all four of the subfactors, the breakdown reveals large achievement gaps for female entrepreneurs (the difference between the blue and purple bars). Those large gaps produce Los Angeles’ poor Index Score (45), below the national average. But it doesn’t explain what is driving those gaps.
Los Angeles is the definition of an industry town. To explore how LA’s core industries relate to the challenges faced by female founders, click on “Industry Fingerprint”. You’ll find it in the breakdown next to “Metro Data”. And I am sure that you are “shocked, shocked to find that” Entertainment is the largest industry in Los Angeles. LA’s biggest industry as a whole is bad for women23(Index=23) and founders’ choices reflect this. Fewer than one in five founders in this industry are women. By comparison, the relatively smaller (but also overrepresented) eCommerce (Index=70) and Footwear & Apparel (Index=76) have nearly twice as much female representation. Past research suggests that women are both choosing to work in more inclusive industries but also struggling with investors that will only fund women incertain getthoized businesses24.
There’s one more step to understand how industry affects women’s outcomes. Click on “Means” and you see that Entertainment has nearly as large an achievement gap for individual women as it does in “Totals”, while eCommerce appears like an even better option. Footwear & Apparel, however, has switched from wonderful to terrible; though it attracts a large number of female founders, individual founders are still struggling in the industry. You now have actionable insights:
- Break down social barriers for women in Entertainment. There are plenty of women in the industry, but it’s hostile.
- Invest strongly in women in eCommerce.
- Money flowing into Footwear & Apparel reflects bias about women’s competences, and it’s not paying off for anyone.
You’ve seen how the relative rates of entrepreneurship in individual industries affects the Industry Index Score. The same is true in Los Angeles as a whole. Click on “Chart” and select “Entrepreneurs per 100K”. You’ll see that Los Angeles’ entrepreneurship rate for women is well above the national average. Another chart shows the proportion of entrepreneurs in Los Angeles that are female. Although individual female entrepreneurs are struggling in LA, a relatively high number of women found companies there. That higher than average rate lifts up their subfactors in “Totals”. Even though those companies create fewer jobs and bring in less funding on average, there are simply more of them.
(Click on “Totals” while viewing the entrepreneurship rate “Chart” and you’ll see that it stays the same. Whether we are talking about “Means” or “Totals”, the number of female entrepreneurs per 100 thousand people in a Metro doesn’t change.)
If Los Angeles’ slightly higher than average entrepreneurship rate is masking weaknesses in the inclusivity of its economy, then perhaps we also have an answer for San Francisco too. The Bay Area’s rate of female entrepreneurship (33 per 100K) isn’t just the highest in the nation, it is three times greater than the next highest, Austin (11 per 100K). You can click directly on San Francisco in the “Chart”, and the Index will take you to San Francisco’s breakdown.
San Francisco could have created nearly 4 million more jobs (a third of the US pre-COVID-19 unemployment rate) if female founders had been given the reins to their own potential. Much like LA, San Francisco has a large number of inhospitable industries such as Saas, Entertainment, and the Financial sector. Though the “Industry Fingerprint” shows how challenging this is, it also points to potential strengths and opportunities.
AI is overrepresented in the Bay Area economy, with over 200 female-founded companies. As a relatively new industry with high potential impact, AI could be particularly effective in reducing achievement gap. Two large industries, Semiconductors and Software, have relatively small achievement gaps in the US but have startlingly few women founding companies in San Francisco or Silicon Valley. In fact, only one of the 882 Software companies in the Bay Area was founded by a woman. Instead of funding women in throwaway industries in San Francisco, focus on transforming AI, Semiconductors, and Software.
Reducing San Francisco’s achievement gap would have a huge impact, not simply on female founders but on the lives of everyone. Click on “Metro Data” for San Francisco and you see both the exceptional totals in blue–$42 billion in economic activity, 2100 patents, and 700,000 jobs–and a huge achievement gap compared to the “what ifs” in purple. Along with those millions of jobs that were never created, thousands of potential inventions and tens of billions in economic activity never happened. The achievable funding denied female founders could have shifted the make-or-break point of hundreds companies. Those additional jobs could have employed thousands of your neighbors. And one of those lost patents might have cured my son’s diabetes.
Return to the “Map” and “Totals”. The third largest bubble in California, San Diego, looks a lot like San Francisco and LA with an Index Score of 49. But when we look at “Means”, its score jumps to 69. Individual female entrepreneurs in San Diego are bringing in nearly as much “Funding” as their male peers and even exceeding them in “Exits”. In “Charts”, you see that its entrepreneurship rate (per 100k) is slightly better than Los Angeles, but nowhere near San Francisco; however, its proportion of female entrepreneurs is only ¾ that of Los Angeles. Given the high performance of individual female founders in San Diego, you would substantially increase the size of the Metro economy by increasing the representation of female entrepreneurs.

You may be surprised that the biggest “Means” bubble in California is Sacramento, where women are apparently still mining gold. Sacramento’s 28 female entrepreneurs transform its modest contribution in “Totals” (74) into a big pool of green in “Means” (95). The Metro is supporting women in both absolute and relative terms. On average, women in Sacramento are outperforming men in funding and patents (third and fourth highest in the country, respectively), and are nearly as high as men in jobs (a repeated issue for female entrepreneurs) and exits.
Individual female entrepreneurs in Sacramento are bringing in 50% more in funding than their female peers in San Francisco and an astonishing three times more than the men in their own Metro. Many aspiring entrepreneurs in the Central Valley surely hitchhike to LA or the Bay to make it big, but Sacramento has a strong case as the future home of female entrepreneurship in California. Using the Index, you can tell women from across California, “We’re warmer than San Francisco, cheaper than LA, an hour from Lake Tahoe, and not just AgTech anymore...oh, and did we mention that we are the capital city of the 6th largest economy in the world?”
Your last mystery is the divergence of Santa Barbara and San Luis Obispo, two isolated communities on the central coast heading in different directions for female founders. Santa Barbara seems to have every advantage–money, a big research university, and easy access to LA–but as a whole its performance is quite poor compared to San Luis Obispo, with the highest Index Score in both “Totals” (75) and “Means” (98). Individual female founders in San Luis Obispo are outperforming men in every subfactor but they trail in Santa Barbara. Explore and test your own hypothesis.
Exploring the rest of the map of the United States, you see that the dominant industries are a driving factor in the Scores for many Metros. For example, eCommerce is a consistently positive force for women in New York and Chicago. Women in Nashville and LA struggle to find parity in Entertainment, while SaaS holds back female founders in San Francisco, Salt Lake City, and Austin. This might be the answer to our question about why Houston’s relatively small community of female founders is outperforming Austin; though few women found companies in the Energy sector, those that do have found much greater success than the women forced to solve tech bro problems in Austin’s (and San Francisco’s) startup culture.
Even though Charleston is pretty small, it has a relatively high proportion of female entrepreneurship (15%) and those female founders are knocking it out of the park with individual founders bringing in three times the amount of economic activity on average as their male counterparts. Like Charleston, Spokane’s high “Totals” score (83) comes from a high rate of entrepreneurship, while its exits contribute to its high “Means” score of 93. Allentown25 (88) tells a similar story–its 7 female entrepreneurs brought in nearly $150 million in economic activity. Bend and Burlington both have high proportions of female founders bringing their “Totals” scores up but the individual performance of these entrepreneurs in “Means” isn’t nearly as good as Charleston.
One of the biggest challenges for Metros like Champaign, a city dominated by inhospitable industries like Bio Tools, is the brain drain to bigger and more inclusive neighbors.
Your exploration of California also offers insights for Metros performing poorly across the US. Champaign (24) has half the entrepreneurship rate as the national average, a pretty extreme contrast to nearby Chicago (79). One of the biggest challenges for Metros like Champaign, a city dominated by inhospitable industries like Bio Tools, is the brain drain to bigger and more inclusive neighbors. Grand Rapids (21) has the lowest entrepreneurship rate and one of the lowest entrepreneurship proportions, suggesting that the allure of neighbors like Chicago and Ann Arbor26/Detroit are drawing away female founders. Des Moines (20) is dominated by inhospitable industries like SaaS and Banks, while Chattanooga’s (18) dismal score comes from its incredibly low proportion of female founders–only 3 out of 86, less than half the national average. Finally, Salt Lake City (21), the worst performing big Metro. It is dominated by SaaS and Tech Hardware, has no major exits for female founders, and only 65 out of 982 entrepreneurs are women. For all of these cities, your daughters are either moving away or staying home.
While the Metros above perform poorly in both “Means” and “Totals”, a number of others are like San Diego and Houston where smaller numbers of women find outsized success. San Antonio, Greenville, and Phoenix cross from below to above the national average when we switch to “Means”. Other Metros are like San Francisco and Los Angeles, even worse in “Means” than in “Totals”. Burlington and Bend, for example, go from some of the highest performers in “Totals” to just OK for the individual. Louisville, Memphis, and Knoxville also see a sharp fall in “Means”. Even though there are a significant number of women founding companies in these Metros, they are having a difficult time finding opportunities to succeed.
Now you’ve learned how to use the Index to reinvent your city for female founders. The Index doesn’t stop there.
I have a pretty amazing life. I get to travel around the world and solve problems27. In every city that I’ve visited across so many countries, people always want to show me their “innovation hub”. Sometimes it’s a government-sponsored industrial park complete with shiny white buildings. Others are university-sponsored “incubators” hosting hackathons, or maybe it’s an “accelerator” inside some massive bank downtown. What’s interesting is that they all look exactly the same. They’ve all been told to be just like the Googleplex. In every one of these manufactured policy boondoggles in every city, no one is innovating on innovation.
What is the point of either St. Louis or São Paulo trying to be San Francisco? The whole point of innovation is to be different. Different cities get different for free. Why strive so hard to be the same? There are some well known universals to innovation and high-growth entrepreneurship, such as high quality research universities and cultural looseness, but there’s very little reason to believe that one fixed set of policy prescriptions will turn the creative potential of a local community into the founders of companies. My motivating vision for the Index was a tool to illuminate job-creating policies born out of all of those differences.
If I wanted a tool that could actually help policy makers, investors, and entrepreneurs themselves to make better decisions...It had to be as alive as the ecosystem it was measuring.
What I wanted was something more than a report; I wanted a live tool that could show what was actually happening in your city. How many jobs were being created? By whom, and where did these people come from? What was holding them back and what pushed them forward? If I wanted a tool that could actually help policy makers, investors, and entrepreneurs themselves to make better decisions, it had to be something that could answer questions. It had to be as alive as the ecosystem it was measuring.
My team at Socos Labs began by drawing in publicly available resources, such as records from the US Patent and Trademark Office and US Census. We mashed this up with other data on entrepreneurs themselves generously donated by companies including Crunchbase. Our collaborators at StartOut, leveraging support from the JP Morgan Foundation, purchased access to even more research data on people and companies and jobs. It was amazing to see all of this information flowing together, not to sell another ad, but to understand how people built their own communities. But there was a hole.Early prototypes of the Inclusion Impact Index produced powerful insights on the contributions of female and Black entrepreneurs, as well as interregional inequality, but in the absence of one crucial dataset, we found it hard to bring insights on Queer entrepreneurs out of the closet. The models I built for the original StartOut report was based on proprietary data from my old company, Gild, which had been acquired in the intervening years. Without those models to identify them, the truth is that we simply don’t have a good census of Queer founders and their impact. It has taken an enormous push inside StartOut and across our communities to create an entirely new survey of Queer entrepreneurs for the Index.
...whole populations are often forced to hide who they actually are just to participate in America.
Our first and most imperative next step is to expand the Index to include everyone. But it turns out that understanding each population presents unique challenges. We can already identify a large number of Latine founders in our dataset, but they represent such diverse and varied origins–Mexican American, Puerto Rican, Cuban American, immigrant–that we need to develop specialized models to make certain we understand the disparate challenges and contributions of each group. Black entrepreneurs are just as diverse a population and have experienced well documented discrimination in venture capital; we’re developing specialized models to identify some of the unique funding sources that they have tapped into. In some cases, the biases go far deeper than funding, and whole populations are often forced to hide who they actually are just to participate in America. Despite this, we know that entrepreneurs overcoming disabilities and those that have gone through gender transition are also creators and must be included in our Index. And of course, there is the group that inspired the Index in the first place: refugees and Dreamers. Despite talk of walls and Supreme Court defeats over the last four years, how much better is America because these people came and created something new?
The Index also needs to recognize that identity is never one thing. My own family is proudly different in so many ways that we frequently lose count. Socos Labs is building new models to understand intersectionality and the experience of being Latina in finance, Black and gay in the tech industry, or an autistic refugee building something no one ever conceived of before. It will take time and hard work to add these populations and many more, but America needs everyone.
It turns out that Canada needs everyone too! It’s also ridiculous to build a tool to understand the entrepreneurial economy of the United States without also measuring the impact of founders in Vancouver, Toronto, Calgary, Montreal, and all the other Canadian Metros. For that matter, Mexico City, London, Tel Aviv, Singapore, and numerous other global entrepreneurial hubs are part of an interconnected ecosystem. While female and Queer founders might experience challenges across all of these Metros, each has its own unique populations with their own unique potential. Eventually the Index will cover the globe, measuring the jobs created by women in Nairobi, Lagos, and Kigali. It will reveal the achievable potential of Indigenous founders throughout South America and disenfranchised castes in South Asia.
Along with all of these new people and new places, the Index also needs new capabilities. We are developing an AI-driven Census Fingerprint that integrates masses of data from the US Census Bureau to understand how Metro-wide economic, demographic, and geographic features impact the success of entrepreneurs. An early spoiler? Who knew that greater parkland and more arts programs drive the impact of high-growth entrepreneurship. There’s also a list of dozens of new variables, transformations, and comparisons that we are building into the “Charts” and “Plots” views. There is so much more we plan to do, but there one massive advance in our pipeline: causality.
Socos Labs has been building a major new tool, the Smart Science platform, to take machine learning beyond simple correlations and into actual cause. It is one thing to know that in cities like yours, the amount of parkland and the number of jobs tend to go up and down together. It is vastly more powerful to know that building parks would cause an increase in jobs. Integrating our Smart Science system into the Inclusion Impact Index will allow us to begin identifying these relationships.
Why is this exciting? Many people have reasonable policy recommendations, but there is often little evidence that their recommendations will causally drive change in cities. They are well intentioned but almost entirely driven by intuition and often dominated by the interests of investors. The Index can change that by allowing policymakers, mayors, investors, and others to measure the impact of their policies. If a financial institution wants to run an access to capital program for Black entrepreneurs in the Midwest, they will be able to privately register it with the Index and measure the true impact of that program. State and city economic development offices will finally be able to truly assess how their policies are impacting distal outcomes like job creation and patents.
Will it all work? We don’t call ourselves “Mad Scientists” for nothing. If we knew it would work it wouldn't be science, and if anyone else was doing it, it wouldn’t be mad. Our early research is immensely promising, and if we don’t build it, who will?
You can help. If you’re a policymaker, please use the Inclusion Impact Index to understand your Metro. If you are an investor, use the Index to explore your own biases and find the hidden Alpha in your own neighbors. If you’re a journalist, explore all of the data we have to offer and write stories about the amazing contributions of all of those forgotten founders. We offer the Index free to all of you to create your own impact.
Sponsor the Index–that’s the biggest help. Sponsor Latine entrepreneurs and reveal their impact to the world. Sponsor our expansion to the EU or Africa and help us share the incredible insights and amazing potential of your own community. Socos Labs will continue to slowly expand the Index as quickly as we can, but every new company, foundation, or institution that recognizes the astonishing potential of all those forgotten founders can help accelerate our efforts to share their stories with the world.


